Manually prioritize conservation projects under expected phylogenetic diversity
Source:R/ppp_manual_phylo_solution.R
ppp_manual_phylo_solution.RdManually specify funding schemes for conservation projects using the 'Project Prioritization Protocol' (Joseph, Maloney & Possingham 2009), and evaluate their effectiveness using 'expected phylogenetic diversity' (Faith 2008).
ppp_manual_phylo_solution(x, y, tree, solution, project_column_name,
  success_column_name, action_column_name, cost_column_name)
Arguments
| x |
|
|---|---|
| y |
|
| tree |
|
| solution |
|
| project_column_name |
|
| success_column_name |
|
| action_column_name |
|
| cost_column_name |
|
Value
A tibble object containing the
solution(s) data. Each row corresponds to a different solution, and
each column describes a different property of the solution. The object
contains a column for each project (based on the argument to
project_column_name) which contains logical values indicating
if the project was prioritized for funded (TRUE) or not
(FALSE) in a given solution. Additionally, the object also contains
the following columns:
"solution"integersolution identifier."method"charactername of method used to produce the solution(s).)"budget"numericbudget used for generating each of the of the solution(s)."obj"numericobjective value. If phylogenetic data were input, then this column contains the expected phylogenetic diversity (Faith 2008) associated with each of the solutions. Otherwise, this column contains the expected weighted species richness (i.e. the sum of the product between the species' persistence probabilities and their weights."cost"numerictotal cost associated with each of of the solution(s)."optimal"logicalindicating if each of the solution(s) is known to be optimal (TRUE) or not (FALSE). Missing values (NA) indicate that optimality is unknown (i.e. because the method used to produce the solution(s) does not provide any bounds on their quality).
References
Faith DP (2008) Threatened species and the potential loss of phylogenetic diversity: conservation scenarios based on estimated extinction probabilities and phylogenetic risk analysis. Conservation Biology, 22: 1461--1470.
Joseph LN, Maloney RF & Possingham HP (2009) Optimal allocation of resources among threatened species: A project prioritization protocol. Conservation Biology, 23, 328--338.
See also
For other methods for generating solutions for the 'Project
Prioritization Protocol' problem using phylogenetic data, see
ppp_exact_phylo_solution,
ppp_heuristic_phylo_solution, and
ppp_random_phylo_solution. To visualize the effectiveness of
a particular solution, see ppp_plot_phylo_solution.
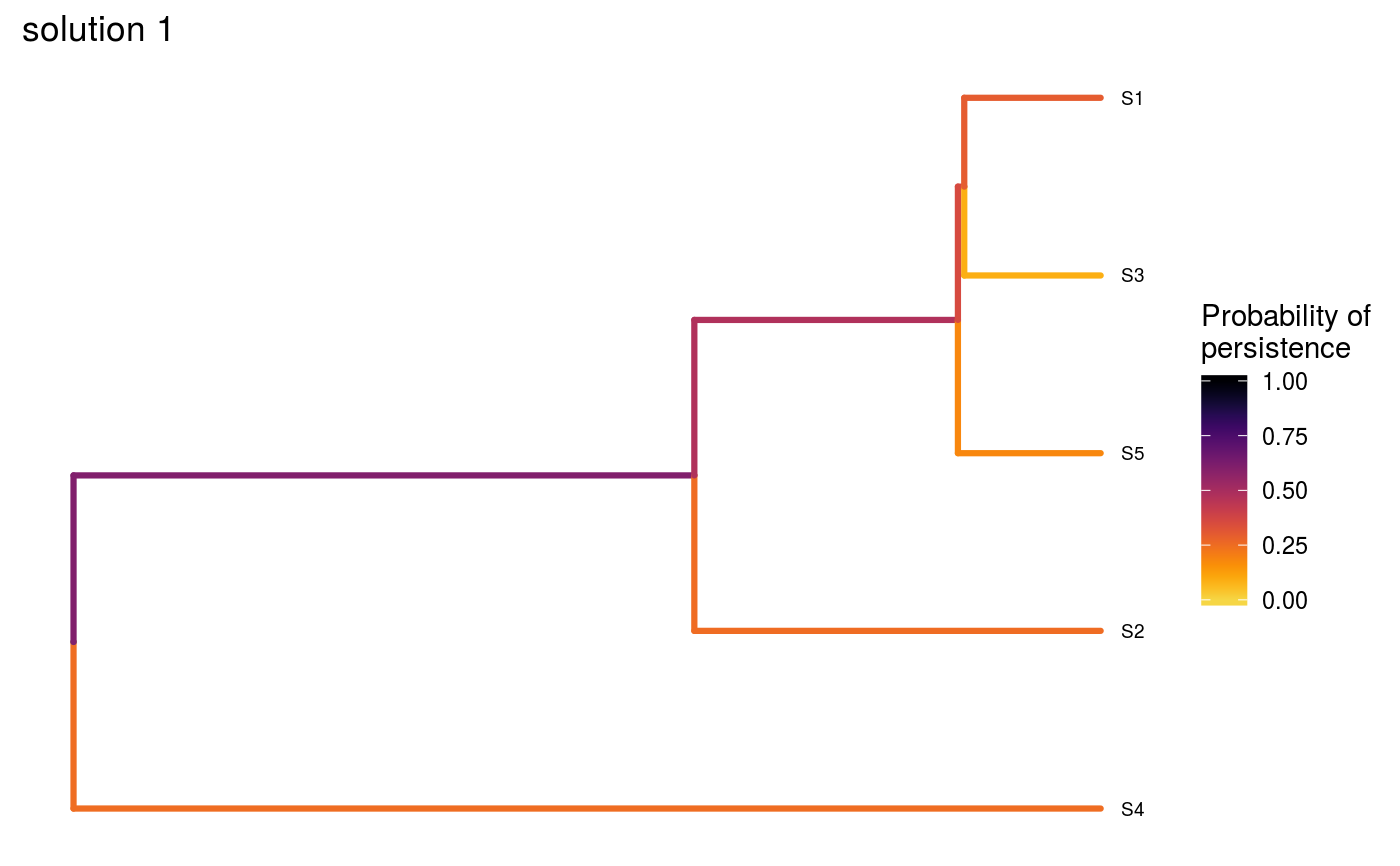
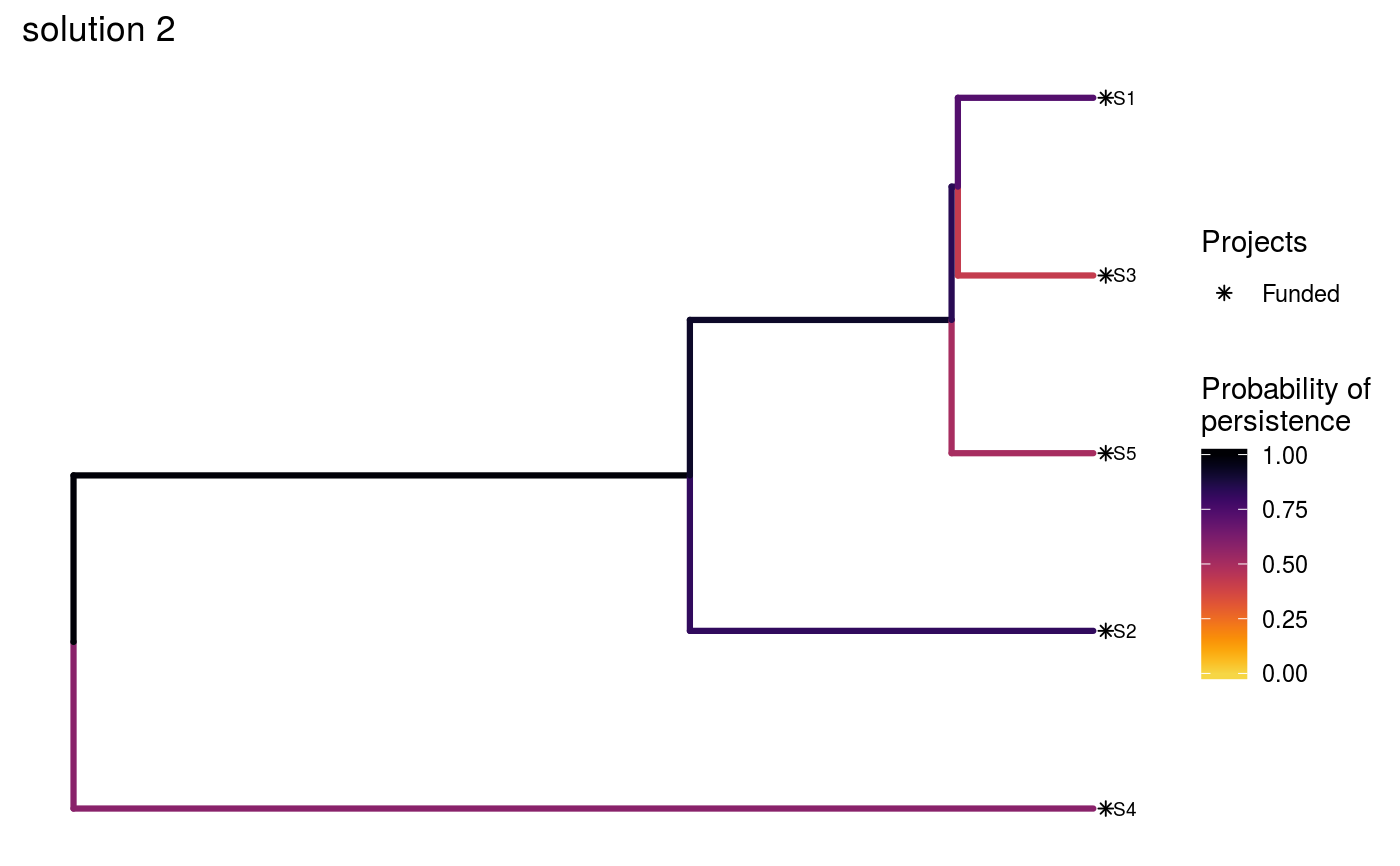
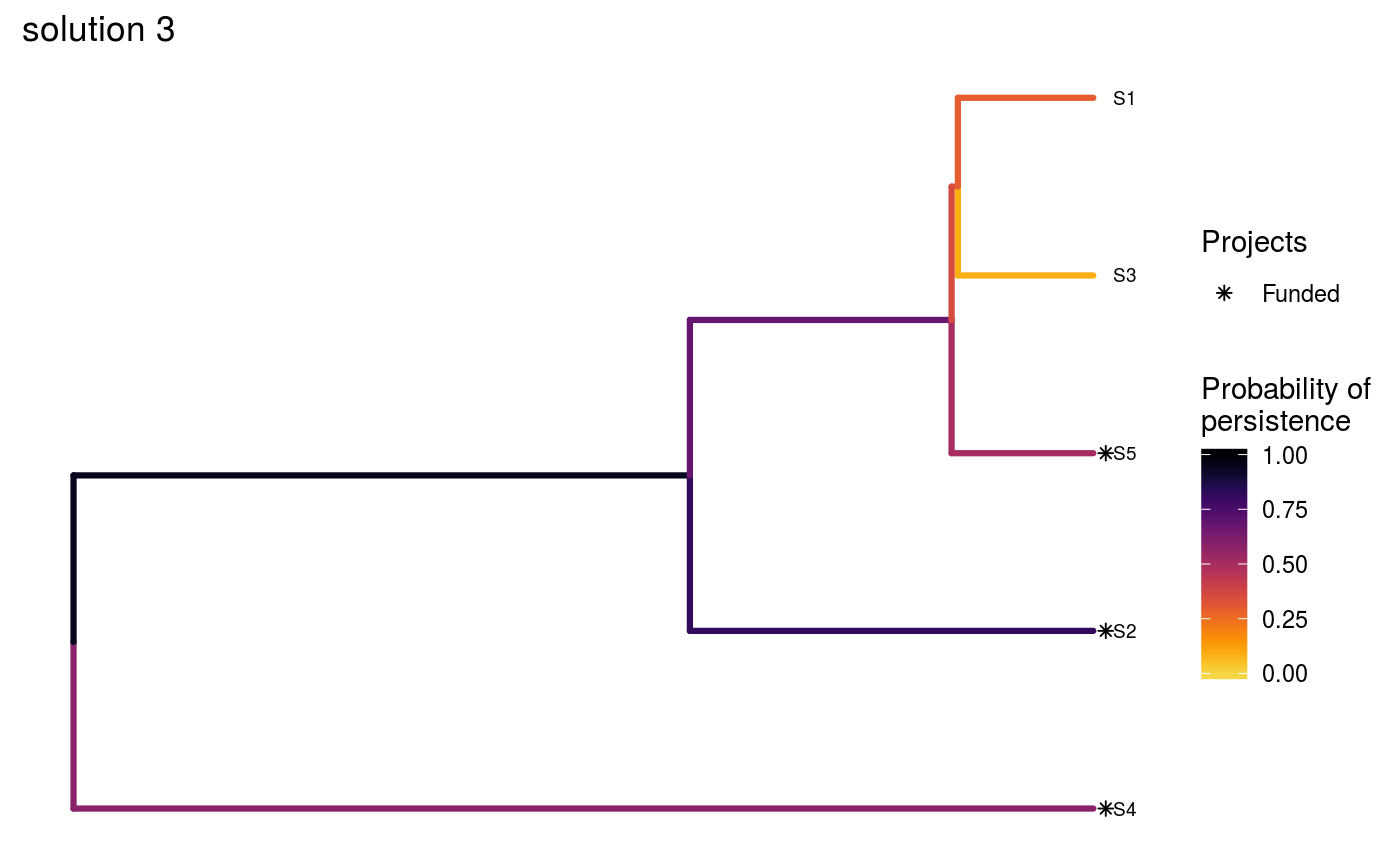
Examples
# set seed for reproducibility set.seed(500) # load built-in data data(sim_project_data, sim_action_data, sim_tree) # load packages to help with plotting library(ggplot2) # print simulated project data print(sim_project_data)#> # A tibble: 6 x 13 #> name success S1 S2 S3 S4 S5 S1_action S2_action S3_action #> <chr> <dbl> <dbl> <dbl> <dbl> <dbl> <dbl> <lgl> <lgl> <lgl> #> 1 S1_p~ 0.919 0.791 0 0 0 0 TRUE FALSE FALSE #> 2 S2_p~ 0.923 0 0.888 0 0 0 FALSE TRUE FALSE #> 3 S3_p~ 0.829 0 0 0.502 0 0 FALSE FALSE TRUE #> 4 S4_p~ 0.848 0 0 0 0.690 0 FALSE FALSE FALSE #> 5 S5_p~ 0.814 0 0 0 0 0.617 FALSE FALSE FALSE #> 6 base~ 1 0.298 0.250 0.0865 0.249 0.182 FALSE FALSE FALSE #> # ... with 3 more variables: S4_action <lgl>, S5_action <lgl>, #> # baseline_action <lgl>#> # A tibble: 6 x 4 #> name cost locked_in locked_out #> <chr> <dbl> <lgl> <lgl> #> 1 S1_action 94.4 FALSE FALSE #> 2 S2_action 101. FALSE FALSE #> 3 S3_action 103. TRUE FALSE #> 4 S4_action 99.2 FALSE FALSE #> 5 S5_action 99.9 FALSE TRUE #> 6 baseline_action 0 FALSE FALSE#> #> Phylogenetic tree with 5 tips and 4 internal nodes. #> #> Tip labels: #> [1] "S3" "S1" "S5" "S2" "S4" #> #> Rooted; includes branch lengths.# now we will create three solutions # first, we will initialize a data.frame with no actions funded solutions <- as.data.frame(matrix(FALSE, ncol = nrow(sim_action_data), nrow = 3)) names(solutions) <- sim_action_data$name # the first solution will have no actions funded except for the base line # actions, so we will make the first value in that column TRUE solutions$baseline_action[1] <- TRUE # the second solution will have all actions funded, so we will set those # values to TRUE solutions[2, ] <- TRUE # the third solution will have four randomly selected actions funded solutions[3, sample.int(nrow(sim_action_data), 4)] <- TRUE # print the manually specified solutions print(solutions)#> S1_action S2_action S3_action S4_action S5_action baseline_action #> 1 FALSE FALSE FALSE FALSE FALSE TRUE #> 2 TRUE TRUE TRUE TRUE TRUE TRUE #> 3 FALSE TRUE FALSE TRUE TRUE TRUE# now we can evaluate the solutions s1 <- ppp_manual_phylo_solution(sim_project_data, sim_action_data, sim_tree, solutions, "name", "success", "name", "cost") # print the output print(s1)#> # A tibble: 3 x 12 #> solution method obj budget cost optimal S1_action S2_action S3_action #> <int> <chr> <dbl> <dbl> <dbl> <lgl> <lgl> <lgl> <lgl> #> 1 1 manual 1.46 NA 0 NA FALSE FALSE FALSE #> 2 2 manual 3.13 NA 498. NA TRUE TRUE TRUE #> 3 3 manual 2.83 NA 300. NA FALSE TRUE FALSE #> # ... with 3 more variables: S4_action <lgl>, S5_action <lgl>, #> # baseline_action <lgl># visualize the effectiveness of the different solutions ppp_plot_phylo_solution(sim_project_data, sim_action_data, sim_tree, s1, "name", "success", "name", "cost", n = 1) + ggtitle("solution 1")ppp_plot_phylo_solution(sim_project_data, sim_action_data, sim_tree, s1, "name", "success", "name", "cost", n = 2) + ggtitle("solution 2")ppp_plot_phylo_solution(sim_project_data, sim_action_data, sim_tree, s1, "name", "success", "name", "cost", n = 3) + ggtitle("solution 3")


