Generate a matrix representing all possible different
survey schemes given survey costs and a fixed budget.
Usage
feasible_survey_schemes(
  site_data,
  cost_column,
  survey_budget,
  locked_in_column = NULL,
  locked_out_column = NULL,
  verbose = FALSE
)
Arguments
- site_data
sf::sf()object containing the candidate survey sites.- cost_column
charactername of the column in the argument to the argument tosite_datathat contains the cost for surveying each site. No missing (NA) values are permitted.- survey_budget
numericthe maximum possible expenditure permitted for conducting surveys.- locked_in_column
character(optional) name of the column in the argument tosite_datathat containslogical(TRUE/FALSE) values indicating if certain sites should be locked into the survey scheme. No missing (NA) values are permitted. Defaults toNULLsuch that no sites are locked in.- locked_out_column
character(optional) name of the column in the argument tosite_datathat containslogical(TRUE/FALSE) values indicating if certain sites should be locked out of the survey scheme. No missing (NA) values are permitted. Defaults toNULLsuch that no sites are locked out.- verbose
logicalindicating if information should be printed while searching for feasible schemes. Defaults toFALSE.
Value
A matrix where each row corresponds to a different
survey scheme, and each column corresponds to a different planning unit.
Cell values are logical (TRUE / FALSE) indicating
if a given site is selected in a given survey scheme.
Dependencies
Please note that this function requires the Gurobi optimization software (https://www.gurobi.com/) and the gurobi R package if different sites have different survey costs. Installation instruction are available online for Linux, Windows, and Mac OS (see https://support.gurobi.com/hc/en-us/articles/4534161999889-How-do-I-install-Gurobi-Optimizer).
Examples
# \dontrun{
# set seed for reproducibility
set.seed(123)

# simulate data
x <- sf::st_as_sf(tibble::tibble(x = rnorm(4), y = rnorm(4),
                                 cost = c(100, 200, 0.2, 1)),
                  coords = c("x", "y"))

# print data
print(x)
#> Simple feature collection with 4 features and 1 field
#> Geometry type: POINT
#> Dimension:     XY
#> Bounding box:  xmin: -0.5604756 ymin: -1.265061 xmax: 1.558708 ymax: 1.715065
#> CRS:           NA
#> # A tibble: 4 × 2
#>    cost               geometry
#>   <dbl>                <POINT>
#> 1 100   (-0.5604756 0.1292877)
#> 2 200    (-0.2301775 1.715065)
#> 3   0.2   (1.558708 0.4609162)
#> 4   1   (0.07050839 -1.265061)

# plot site locations
plot(st_geometry(x), pch = 16, cex = 3)


# generate all feasible schemes given a budget of 4
s <- feasible_survey_schemes(x, "cost", survey_budget = 4)

# print schemes
print(s)
#>       [,1]  [,2]  [,3]  [,4]
#> [1,] FALSE FALSE FALSE FALSE
#> [2,] FALSE FALSE  TRUE FALSE
#> [3,] FALSE FALSE FALSE  TRUE
#> [4,] FALSE FALSE  TRUE  TRUE

# plot first scheme
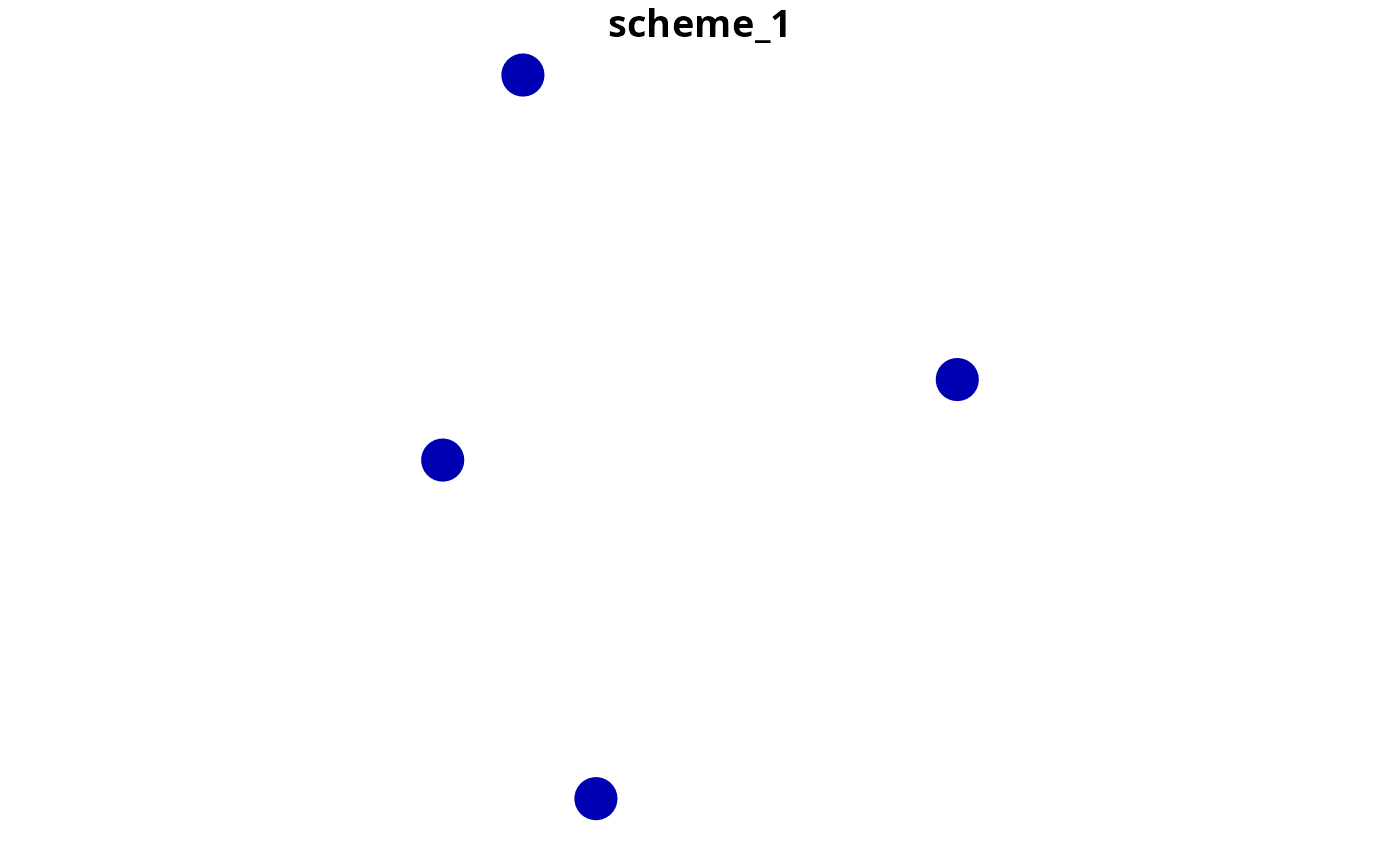
x$scheme_1 <- s[1, ]
plot(x[, "scheme_1"], pch = 16, cex = 3)

# }
# }