Generate a survey scheme by maximizing the diversity of environmental conditions that are surveyed.
Usage
env_div_survey_scheme(
  site_data,
  cost_column,
  survey_budget,
  env_vars_columns,
  method = "mahalanobis",
  locked_in_column = NULL,
  locked_out_column = NULL,
  exclude_locked_out = FALSE,
  solver = "auto",
  verbose = FALSE
)
Arguments
- site_data
sf::sf()object containing the candidate survey sites.- cost_column
charactername of the column in the argument to the argument tosite_datathat contains the cost for surveying each site. No missing (NA) values are permitted.- survey_budget
numericvector of maximum budgets for the survey schemes. No missing (NA) values are permitted.- env_vars_columns
charactervector names of the columns in the argument tosite_datathat containnumericenvironmental variables. No missing (NA) values are permitted.- method
charactername of the distance metric to use for calculating environmental dissimilarity scores. Seevegan::vegdist()documentation themethodparameter for other available distance metrics and more information. No missing (NA) values are permitted. Defaults to"mahalanobis"for Mahalanobis distances.- locked_in_column
character(optional) name of the column in the argument tosite_datathat containslogical(TRUE/FALSE) values indicating if certain sites should be locked into the survey scheme. No missing (NA) values are permitted. Defaults toNULLsuch that no sites are locked in.- locked_out_column
character(optional) name of the column in the argument tosite_datathat containslogical(TRUE/FALSE) values indicating if certain sites should be locked out of the survey scheme. No missing (NA) values are permitted. Defaults toNULLsuch that no sites are locked out.- exclude_locked_out
logicalshould locked out planning units be entirely excluded from the optimization process? Defaults toFALSE.- solver
charactername of the optimization solver to use for generating survey schemes. Available options include:"Rsymphony","gurobi"and"auto". The"auto"method will use the Gurobi optimization software if it is available; otherwise, it will use the SYMPHONY software via the Rsymphony package. Defaults to"auto".- verbose
logicalindicating if information should be printed while generating survey scheme(s). Defaults toFALSE.
Value
A matrix of logical (TRUE/ FALSE)
values indicating if a site is selected in a scheme or not. Columns
correspond to sites, and rows correspond to different schemes.
Details
The integer programming formulation of the environmental diversity reserve selection problem (Faith & Walker 1996) is used to generate survey schemes.
Solver
This function can use the Rsymphony package and the Gurobi optimization software to generate survey schemes. Although the Rsymphony package is easier to install because it is freely available on the The Comprehensive R Archive Network (CRAN), it is strongly recommended to install the Gurobi optimization software and the gurobi R package because it can generate survey schemes much faster. Note that special academic licenses are available at no cost. Installation instructions are available online for Linux, Windows, and Mac OS operating systems.
References
Faith DP & Walker PA (1996) Environmental diversity: on the best-possible use of surrogate data for assessing the relative biodiversity of sets of areas. Biodiversity & Conservation, 5, 399--415.
Examples
# set seed for reproducibility
set.seed(123)

# simulate data
 x <- sf::st_as_sf(
   tibble::tibble(x = rnorm(4), y = rnorm(4),
                  v1 = c(0.1, 0.2, 0.3, 10), # environmental axis 1
                  v2 = c(0.1, 0.2, 0.3, 10), # environmental axis 2
                  cost = rep(1, 4)),
    coords = c("x", "y"))

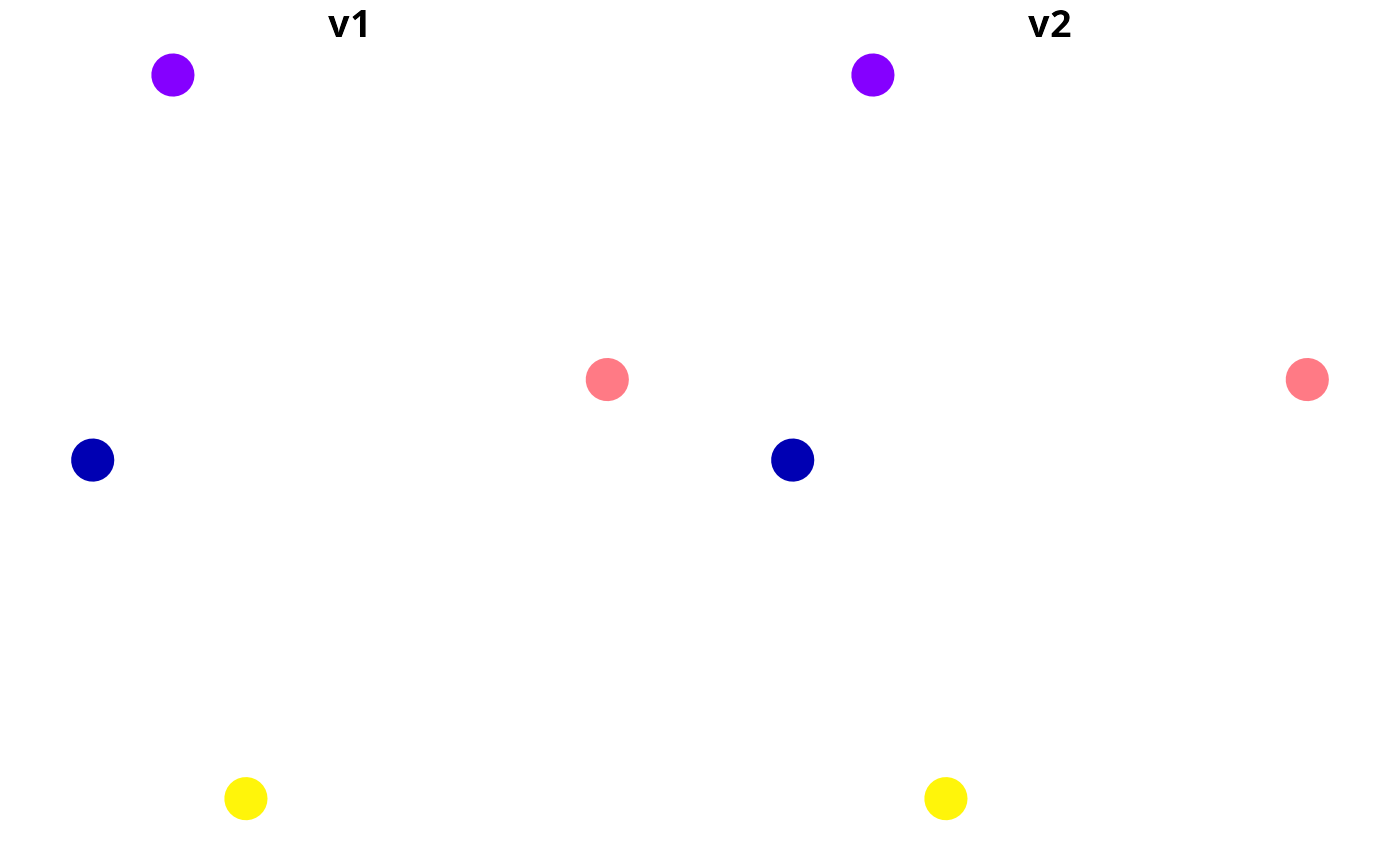
# plot the sites' environmental conditions
plot(x[, c("v1", "v2")], pch = 16, cex = 3)


# generate scheme with a budget of 2
s <- env_div_survey_scheme(x, "cost", 2, c("v1", "v2"), "mahalanobis")

# print scheme
print(s)
#>       [,1] [,2]  [,3] [,4]
#> [1,] FALSE TRUE FALSE TRUE

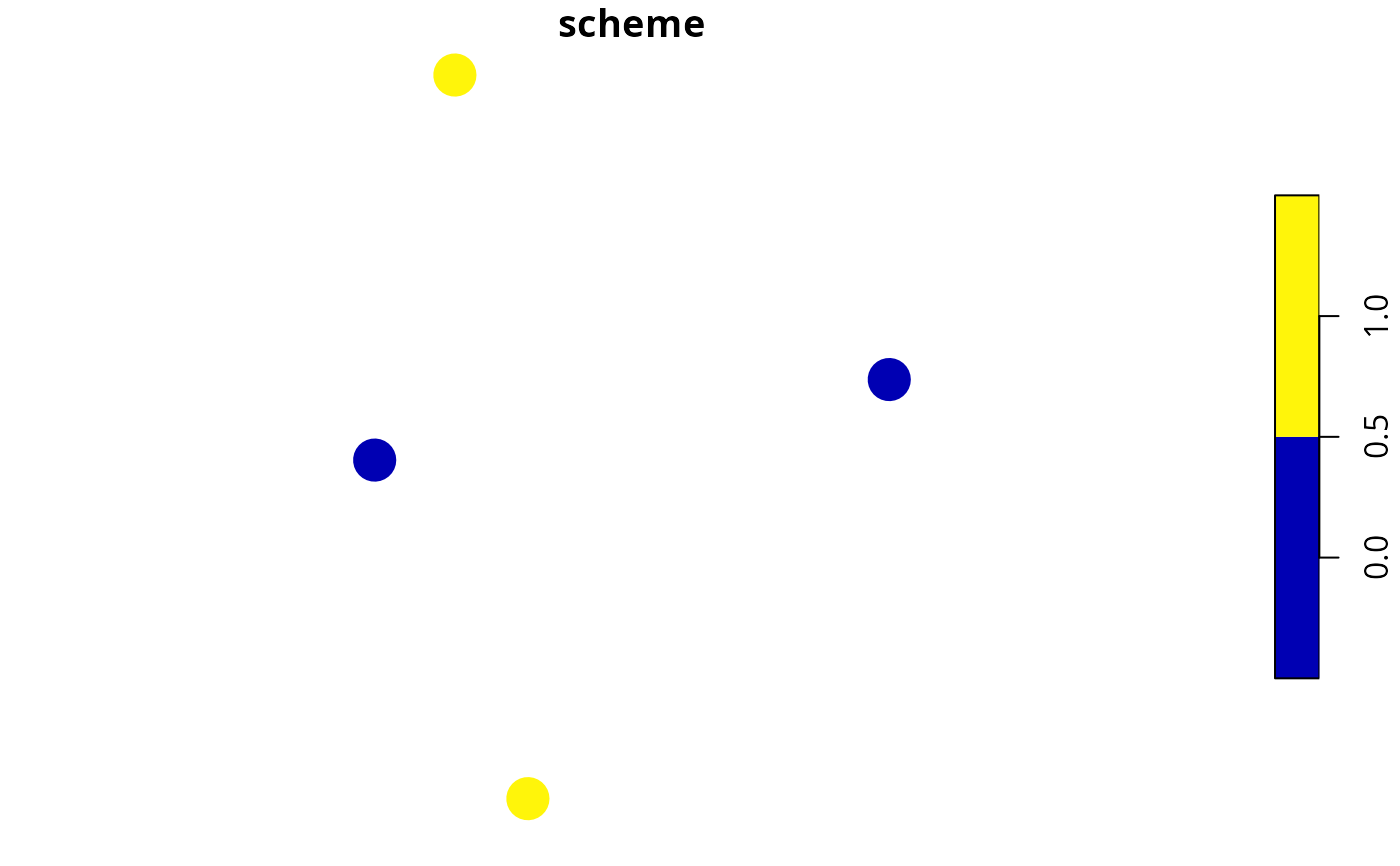
# plot scheme
x$scheme <- c(s)
plot(x[, "scheme"], pch = 16, cex = 3)
